
Prometheus exporter for RethinkDB cluster, server and table metrics.
Supports RethinkDB 2.x
Locally build and run:
    $ git clone https://github.com/oliver006/rethinkdb_exporter.git
    $ cd rethinkdb_exporter
    $ go build
    $ ./rethinkdb_exporter <flags>
Or via docker:
    $ docker pull oliver006/rethinkdb_exporter
    $ docker run -d --name rethinkdb_exporter -p 9123:9123 oliver006/rethinkdb_exporter
A Helm chart is included under helm/ for installing the rethinkdb_exporter on Kubernetes clusters. You'll need one of these per RethinkDB cluster you run.
Installing it is as simple as:
$ cd helm/rethinkdb-exporter
$ helm install \
    --name=rethinkdb-exporter-for-clustername  \
    --set=rethinkdb_exporter.dbaddr=my-rethinkdb-server:28015  \
    --set=rethinkdb_exporter.dbpass=mypassword  \
    --set=rethinkdb_exporter.clustername=myclustername  \
    .
| Name | Description |
|---|---|
| db.addr | Address of one or more nodes of the cluster, comma separated. |
| db.auth | Auth key of the RethinkDB cluster (for versions < 2.3) |
| db.user | Username for RethinkDB connection (for versions >= 2.3) (must be admin if used; see below) |
| db.pass | Password for RethinkDB connection (for versions >= 2.3) |
| db.count-rows | Count rows per table, turn off if you experience perf. issues with large tables |
| db.table-stats | Get stats for all tables. |
| clustername | Name of the cluster, if set it's added as a label to the metrics. |
| namespace | Namespace for the metrics, defaults to "rethinkdb". |
| web.listen-address | Address to listen on for web interface and telemetry, default :9123 |
| web.telemetry-path | Path under which to expose metrics. |
All entries from the stats table of the internal database rethinkdb are exported,
see http://rethinkdb.com/docs/system-stats/ for details.
In addition, for every table there is a gauge with the number of items of said table.
Metric name is rethinkdb_table_items_total{db="...",table="..."}
There are also total counters for numer of servers, tables and replicas as well as number of
errors returned from the stats table.
Metric names are rethinkdb_cluster_[servers|server_errors|tables|replicas]_total
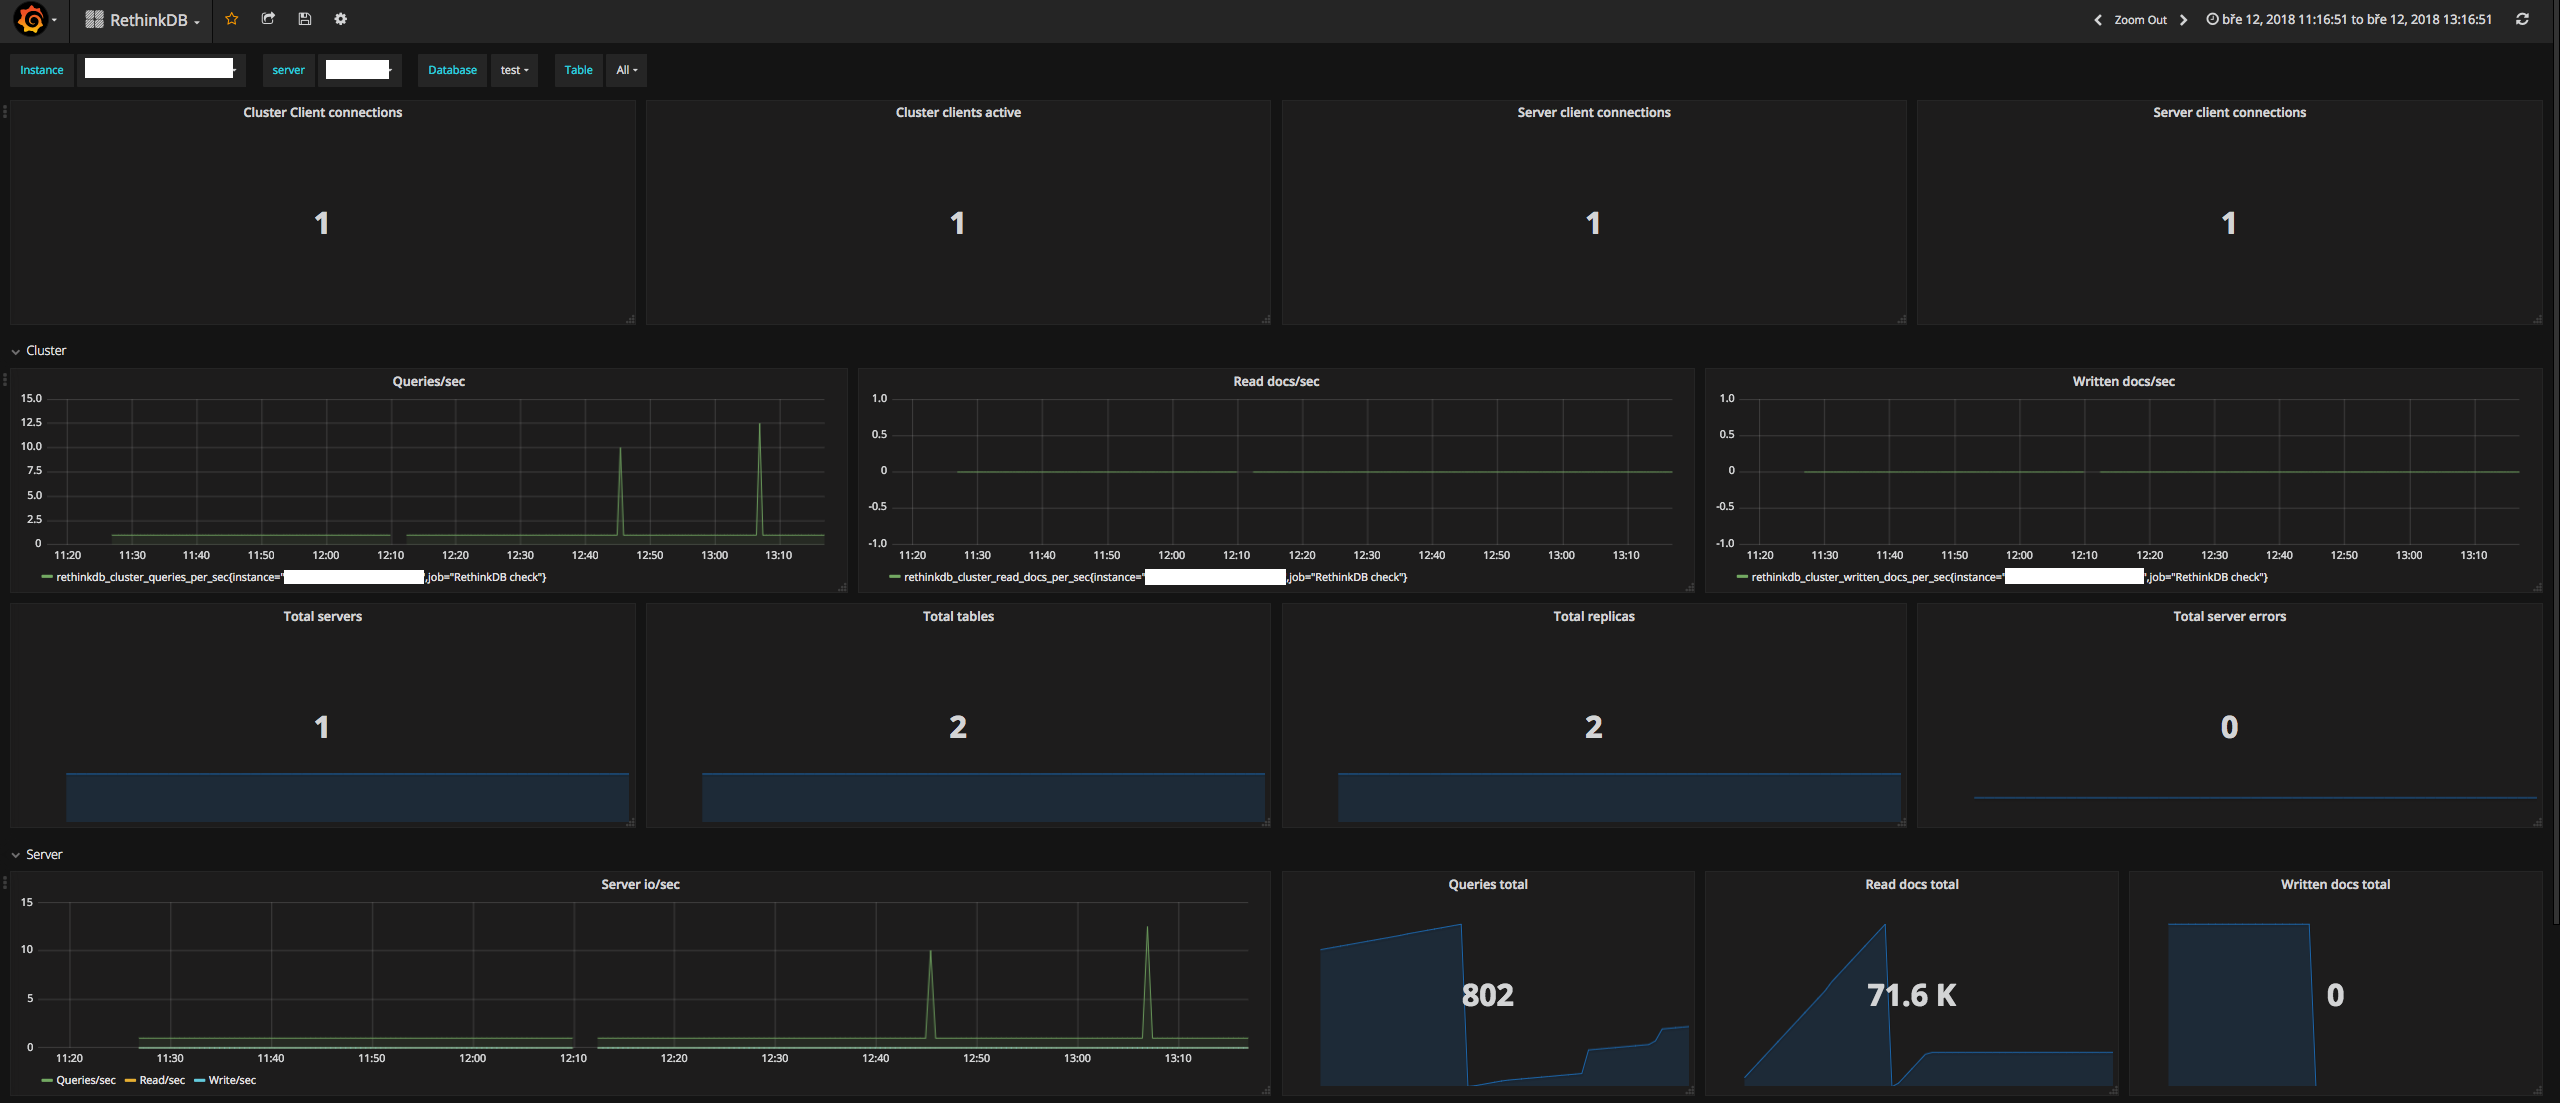
Grafana dashboard is available here:
In v2.3 RethinkDB moved to a username/password authentication system. For compatibility with this use the --db.user and --db.pass options.
It would be good to use a dedicated read-only user for this but the RethinkDB docs say "the jobs table can only be accessed by the admin user account". Thus you'll have to use --db.user=admin.
Things that can/should be added
- status metrics per shard
- ...
Open an issue or PR if you have more suggestions or ideas about what to add.