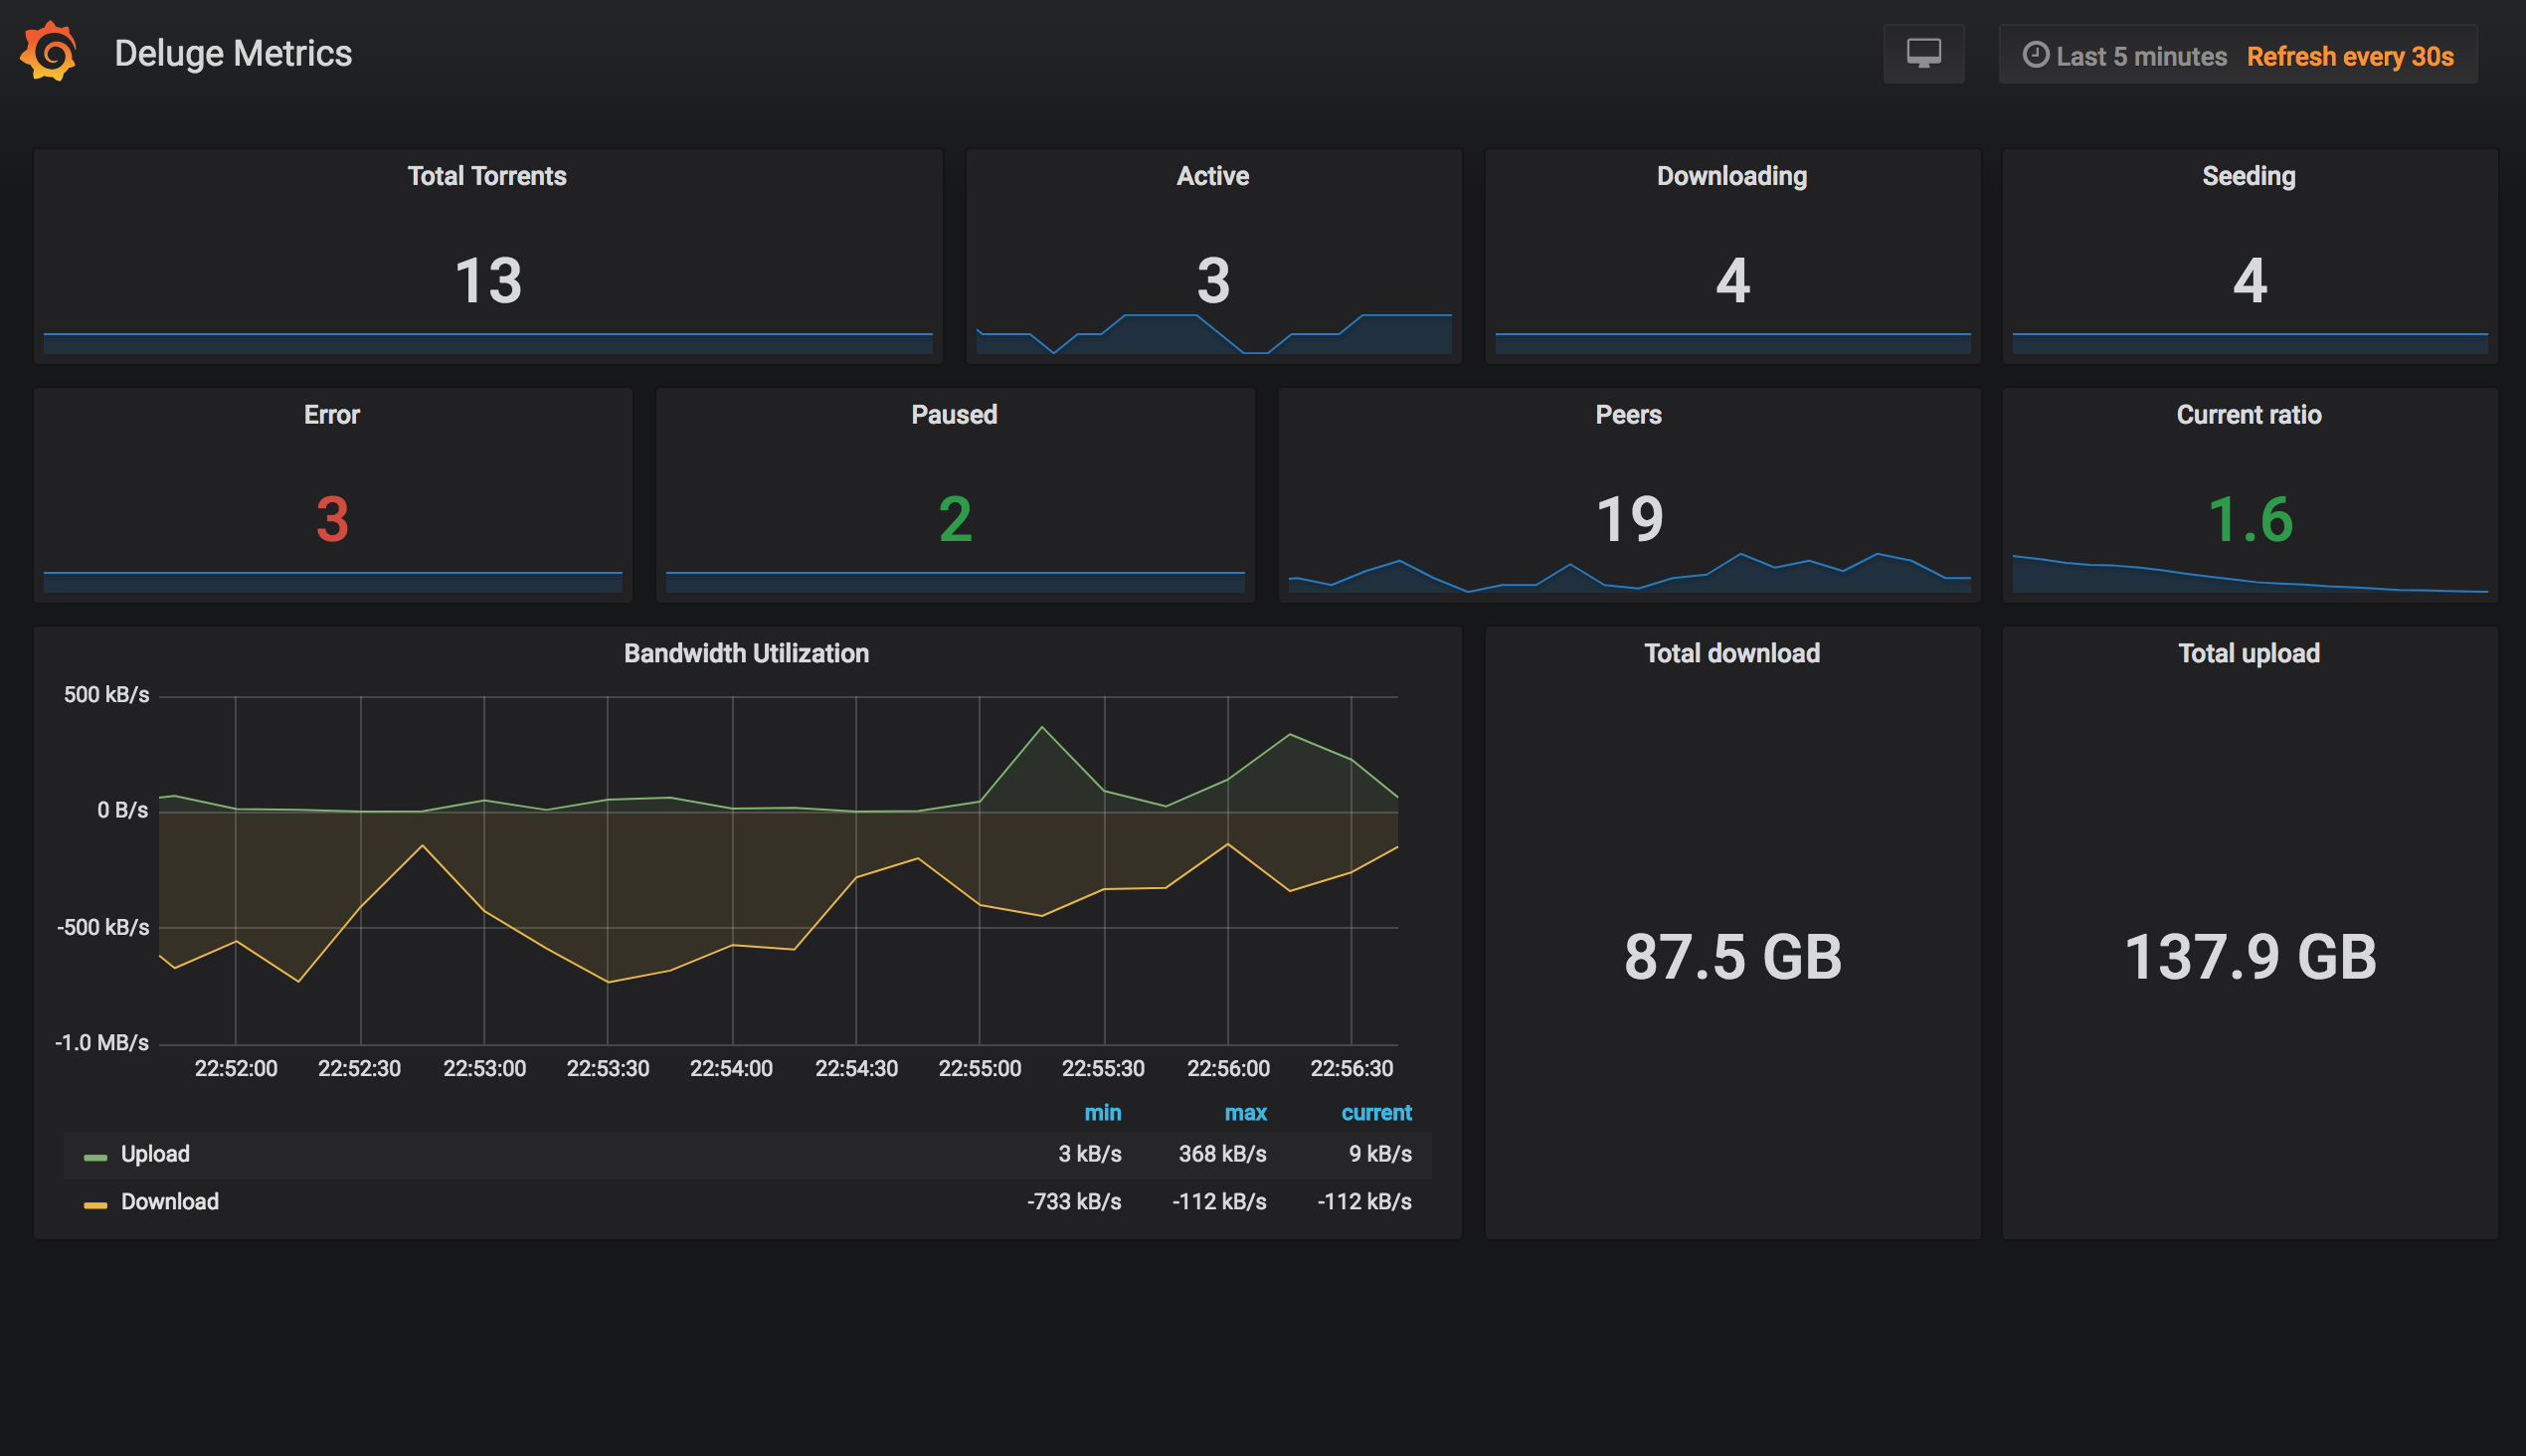
Deluge Dashboard is a very simple way to display Deluge torrent metrics. It uses the Deluge Exporter to populate a Prometheus data source. The panels in this dashboard can be copied into more comprehensive dashboards for a single pane of glass view of your network transfers or it can be used as a standalone glanceboard.
To use, simply import the dashboard into Grafana using ID 9846.
View the dashboard on Grafana.org
You can copy/paste the raw .json data into Grafana via the Dashboards -> Import menu, or save the .json file and import the file.