WMS server provides incorrect figure in the case of dataset update #886
Description
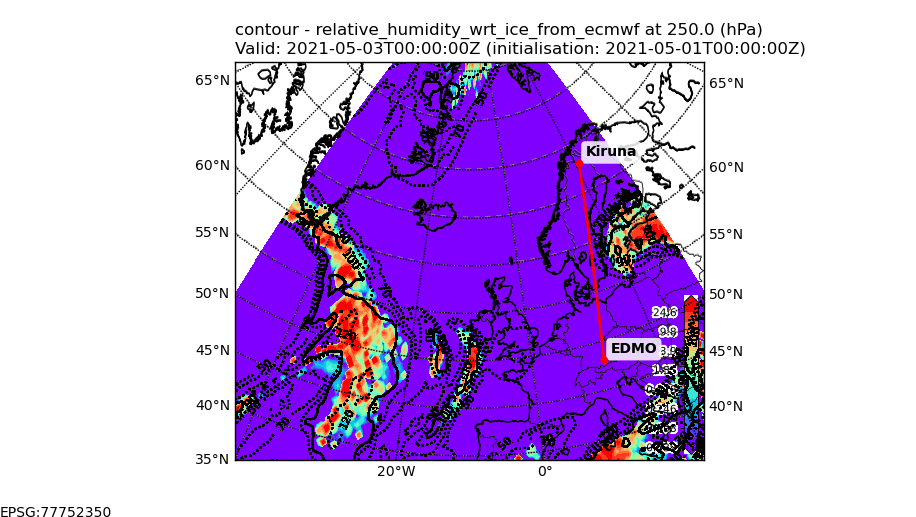
In the calculations for scientific flight planning, it may happen, that a datafile is updated, having the identical filename, but more timesteps. It seems that the server does not check for the update and returns false figures by not correctly interpolating within the data. After re-starting the user interface and clearing the cache, a correct figure is shown.
It is not clear, whether this is a problem of the user interface or of the server.
wrong figure:
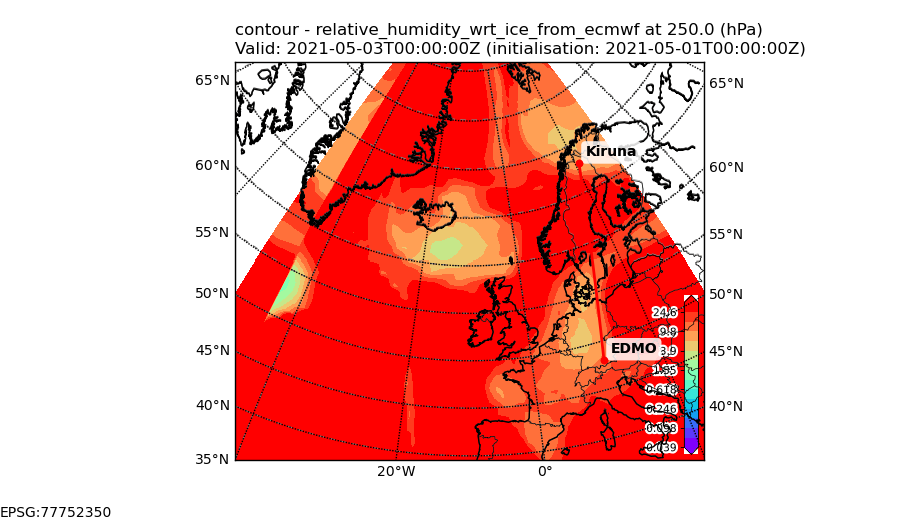
correct figure: